Project overview
Dynamic changes in cell morphology and motility are essential for development and tissue morphogenesis. Cells sense biochemical and mechanical stimuli from ECM and neighboring cells, and invoke complex signal and mechano transduction systems to adapt their geometry, structure, and biophysical properties, and migrate to carry out biological functions. In particular, spatial patterning of ECM causes cell motility undergoing changes in shape, adhesion, or even cell fate (Leong, et al., Commun. & Integr. Biol., 2013, Guetta-Terrier, et al., J. Cell Biol., 2015, Watt, et al., Nature, 2013). Even the response of cells to different ECM spatial patternings has been characterized extensively, the mechanisms by which cells are able to sense changes in ECM geometry at sub-cellular level and translate them into cellular scale behaviors are still not well understood. We propose the study of cell-ECM interaction and explore the mechanism of how cell senses the changes in ECM geometry and translate them into changes of cell shapes and behaviors.
Model setup
We apply CeldyFEM to model the interaction between cell and ECM (see more detials of CeldyFEM). There are two layers in the model: the top layer is the cell layer with group of epithelial cells; The bottom layer is the ECM layer represented as stripes of fibronectins, with predefined width. Here we assume that linear viscoelasticity can adequately describe the mechanical property of the cell during elongation and migration following previous studies (Dokukina, et al., Biophys. J., 2010, Barnhaart, et al., PLoS Biol., 2011). We model the balance of bound and unbound integrin ligand with fibronectin using differential equation and the maturation process of an adhesion point to focal adhesion following previous study (Stéphanou, et al., J. Theor. Biol., 2008). The polarization direction of the cell (the migration direction) is then sampled from the lamellipodal vertices according their adhesion maturation level.
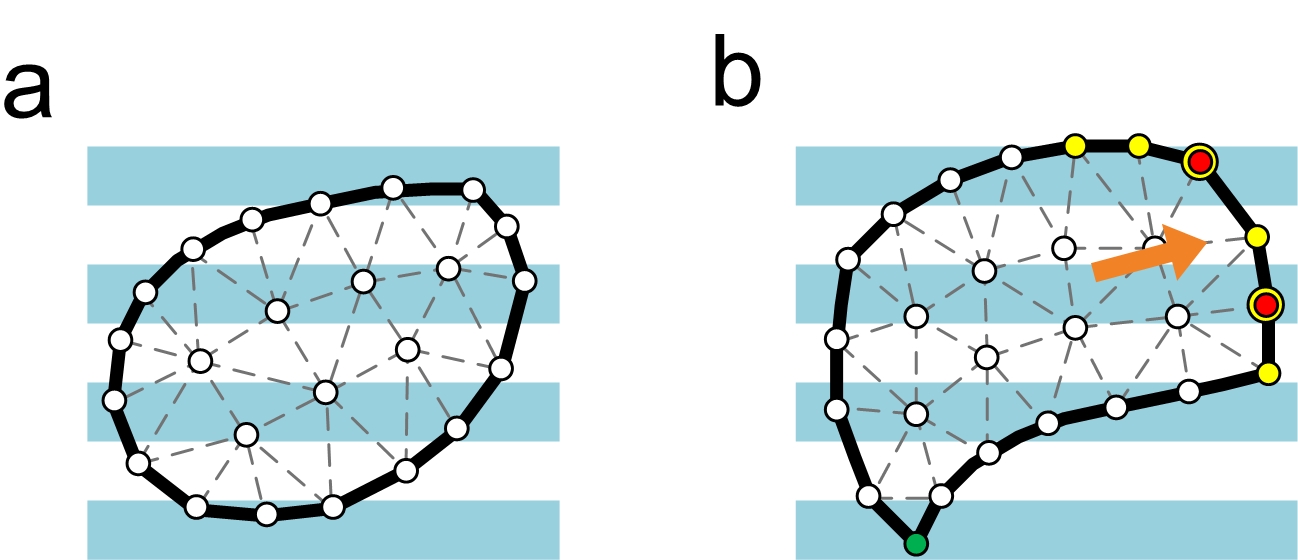
Model of interaction between cell and ECM. (a) Cell is represented as a counter-clock wise oriented polygon tiled up by triangluar mesh and ECM is represented as a group of stripes with predefined width. (b) Once the cell determines the direction of polarization (arrow in orange), the vertices with normal positively aligned with the polarization direction (yellow) are chosen as the lamellipodal. The lamellipodal vertices which are covered by the ECM stripes (blue) are vertices (red) where protrusive forces are applied on. The vertex having the longest average distance from the lamellipodal (green) is chosen as the uropodal.
Results
Cells are guided in response to ECM geometry
We found that as the gap distance between fibronectin stripes increased from 0 Μm to 10 Μm, the cells exhibit elongated morphology. The simulated cells also exhibit the same elongated morphology. In addition, both in vitro and computational studies showed that cells tended to align their migration direction with the ECM orientation. In summary, cells would exhibit directional migration on ECM with the oriented patterns.
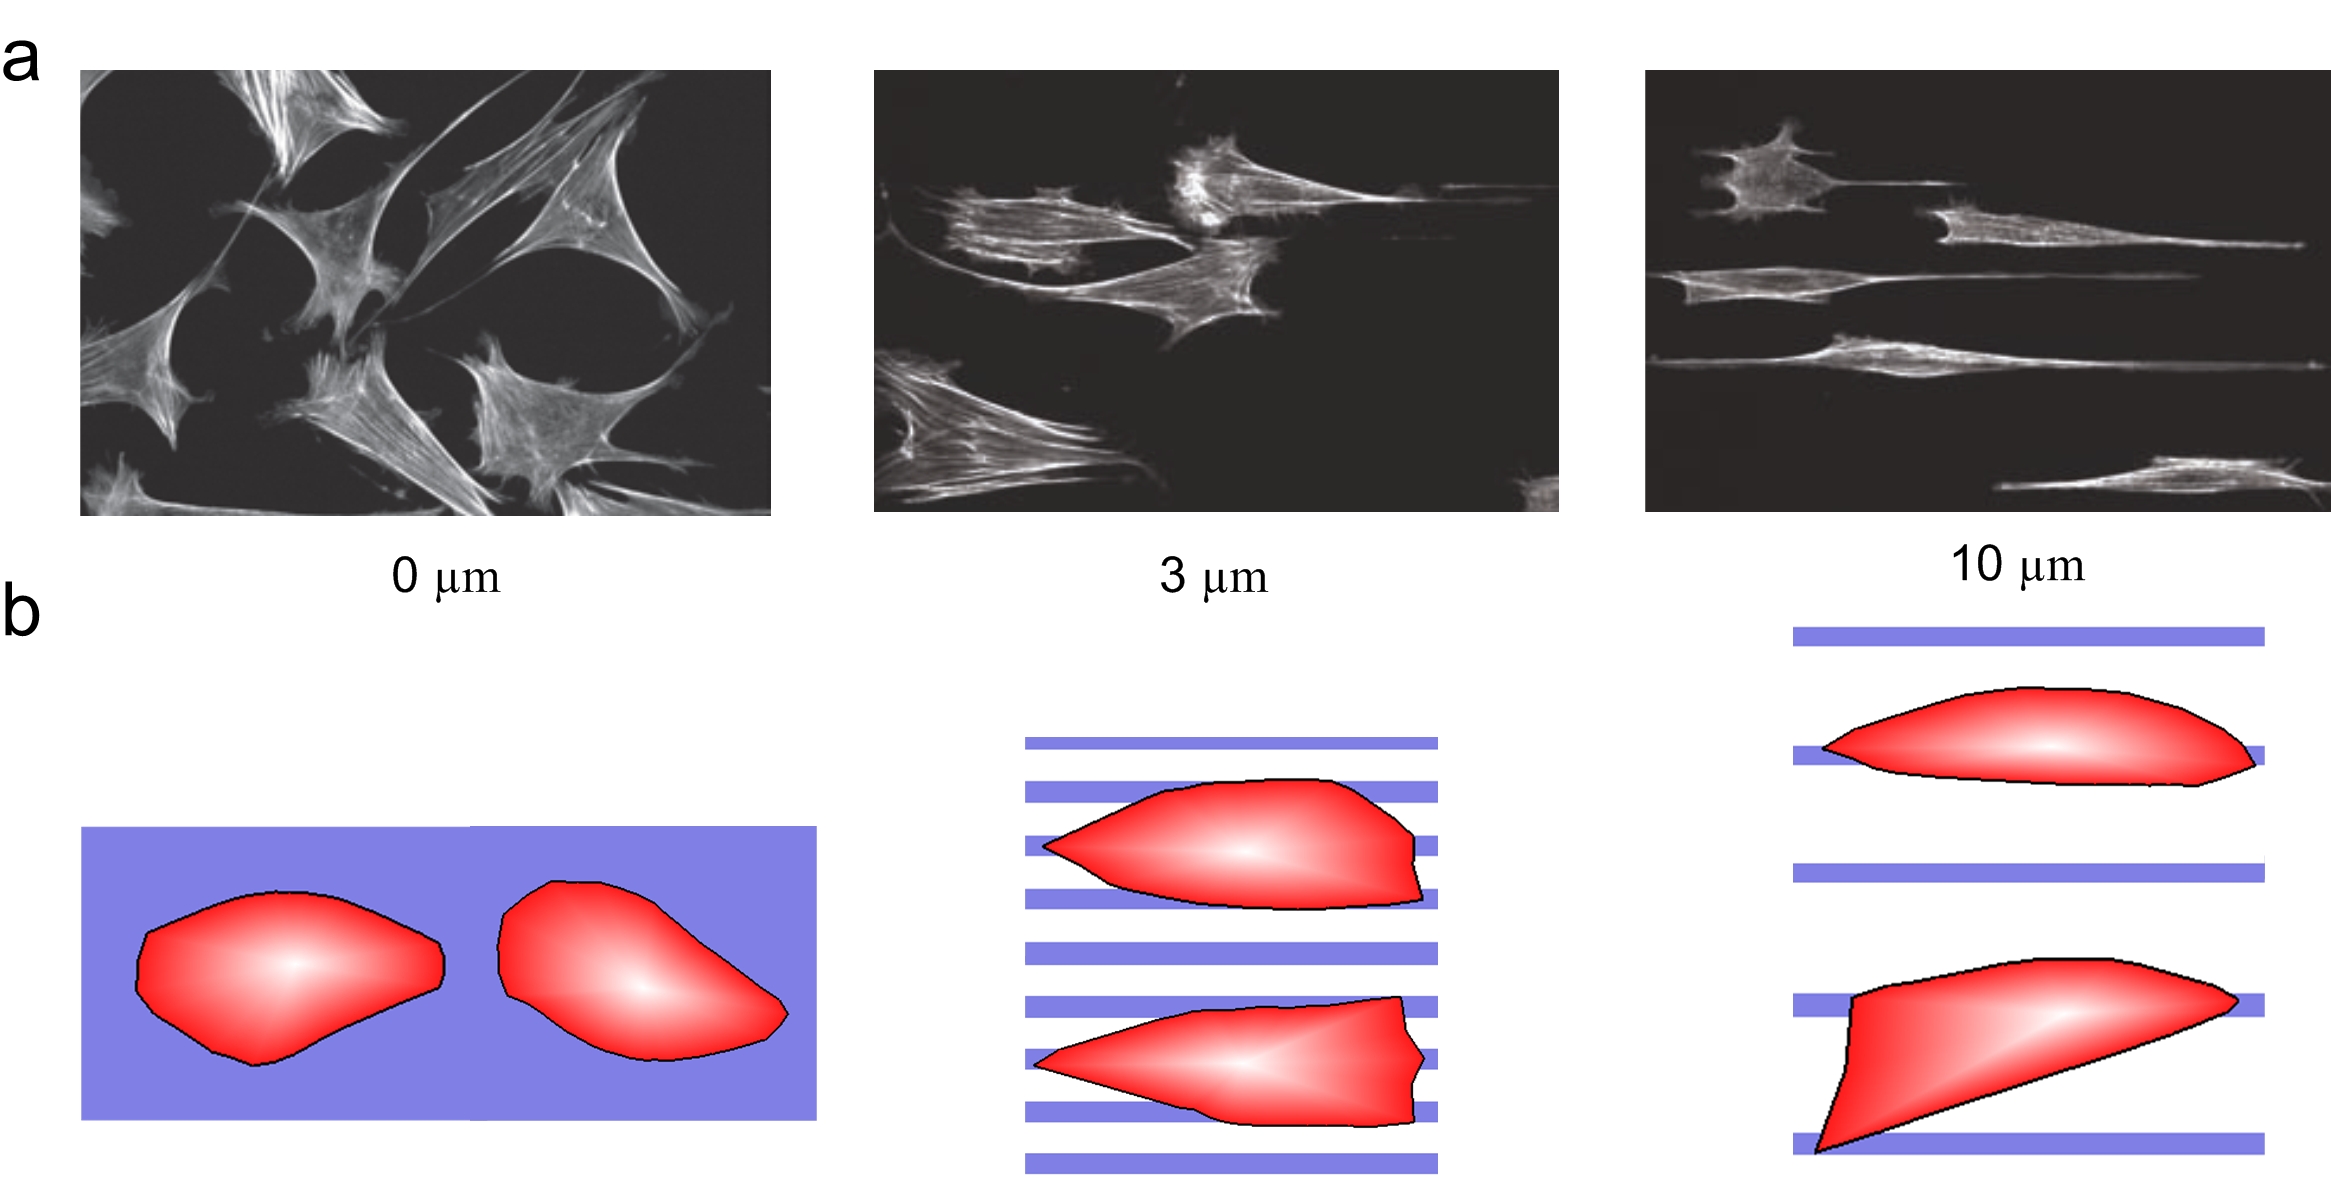
Cell morphology changes under different ECM geometry. (a) The observed cell morphology under different ECM geometry (gaps in 0, 3, and 10 Μm, respectively). (b) The simulated cell morphology under different ECM geometry.
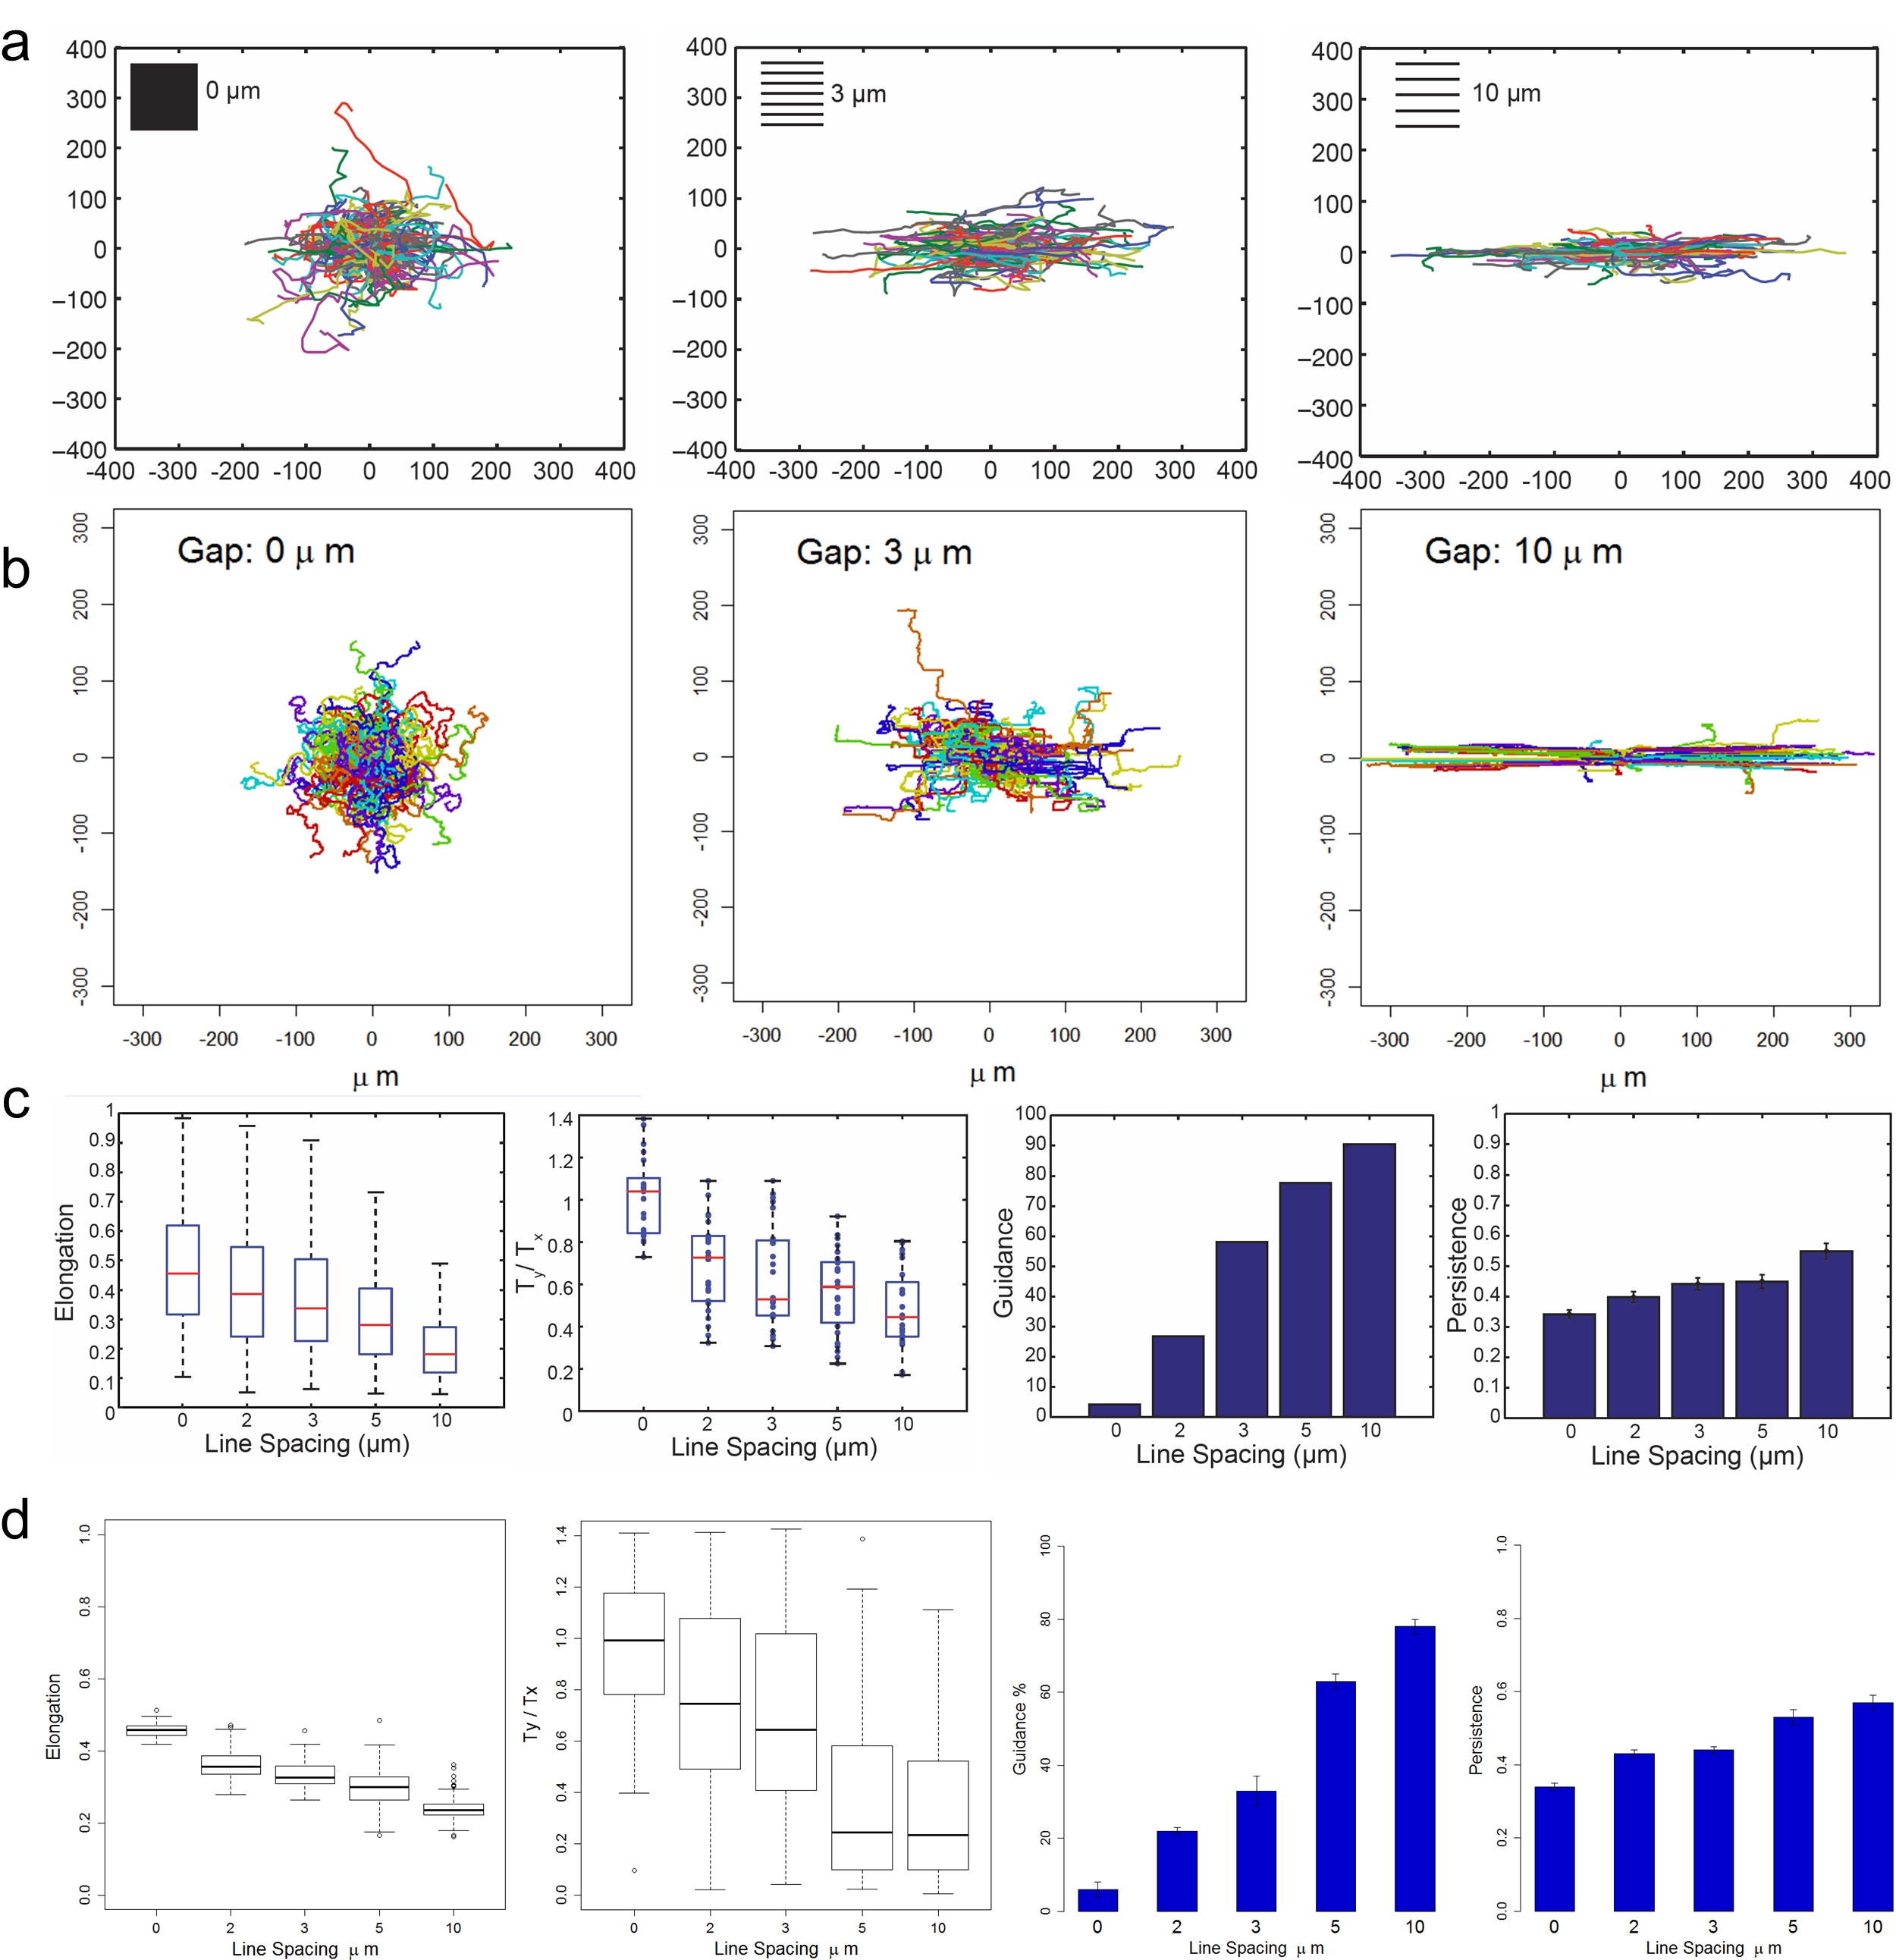
Cells are guided in response to ECM geometry. (a) The observed trajectory of cell migration path. (b) The simulated trajectory of cell migration path. (c) The observed elongation, alignment of traction vectors, guidance and persistence of cells on ECM with different geometry. (d) The simulated elongation, alignment of traction vectors, guidance and persistence of cells on ECM with different geometry.
Myosin II promotes cell migration orientation
Myosin II plays important roles in mediating cell shapes (Rozbicki, et al., Nat. Cell Biol., 2015), reinforcing the cytoskeleton to link to the ECM and driving composition in focal adhesion matruation (Pasapera, et al., J. Cell Biol., 2010, Geiger, et al., Cold Spring Harbor Persp. Biol., 2011). To elucidate its roles in elongation and orientation of cells parallel to the ECM axis, we treated cells with 20 ΜM of the ROCK inhibitor Y27632. Under such treatment, there is a reduce of cellular contractility due to the inhibition of myosin light chain phosphorylation (Rees, et al., Brit. J. Pharmacol., 2001). In the computational model, we reduce of the value of contractile stress to mimic the reduce of the myosin-induced contractility. We also reduced the value of adheison type weight to mimic the perturbation of polarization due to the reduced mechanosensing from focal adheison (Prager-Khoutorsky, et al., Nat. Cell Biol., 2011). Both of the in vitro and computational studies showed that the cell migration under the myosin inhibition was less influenced by the pattern direction.
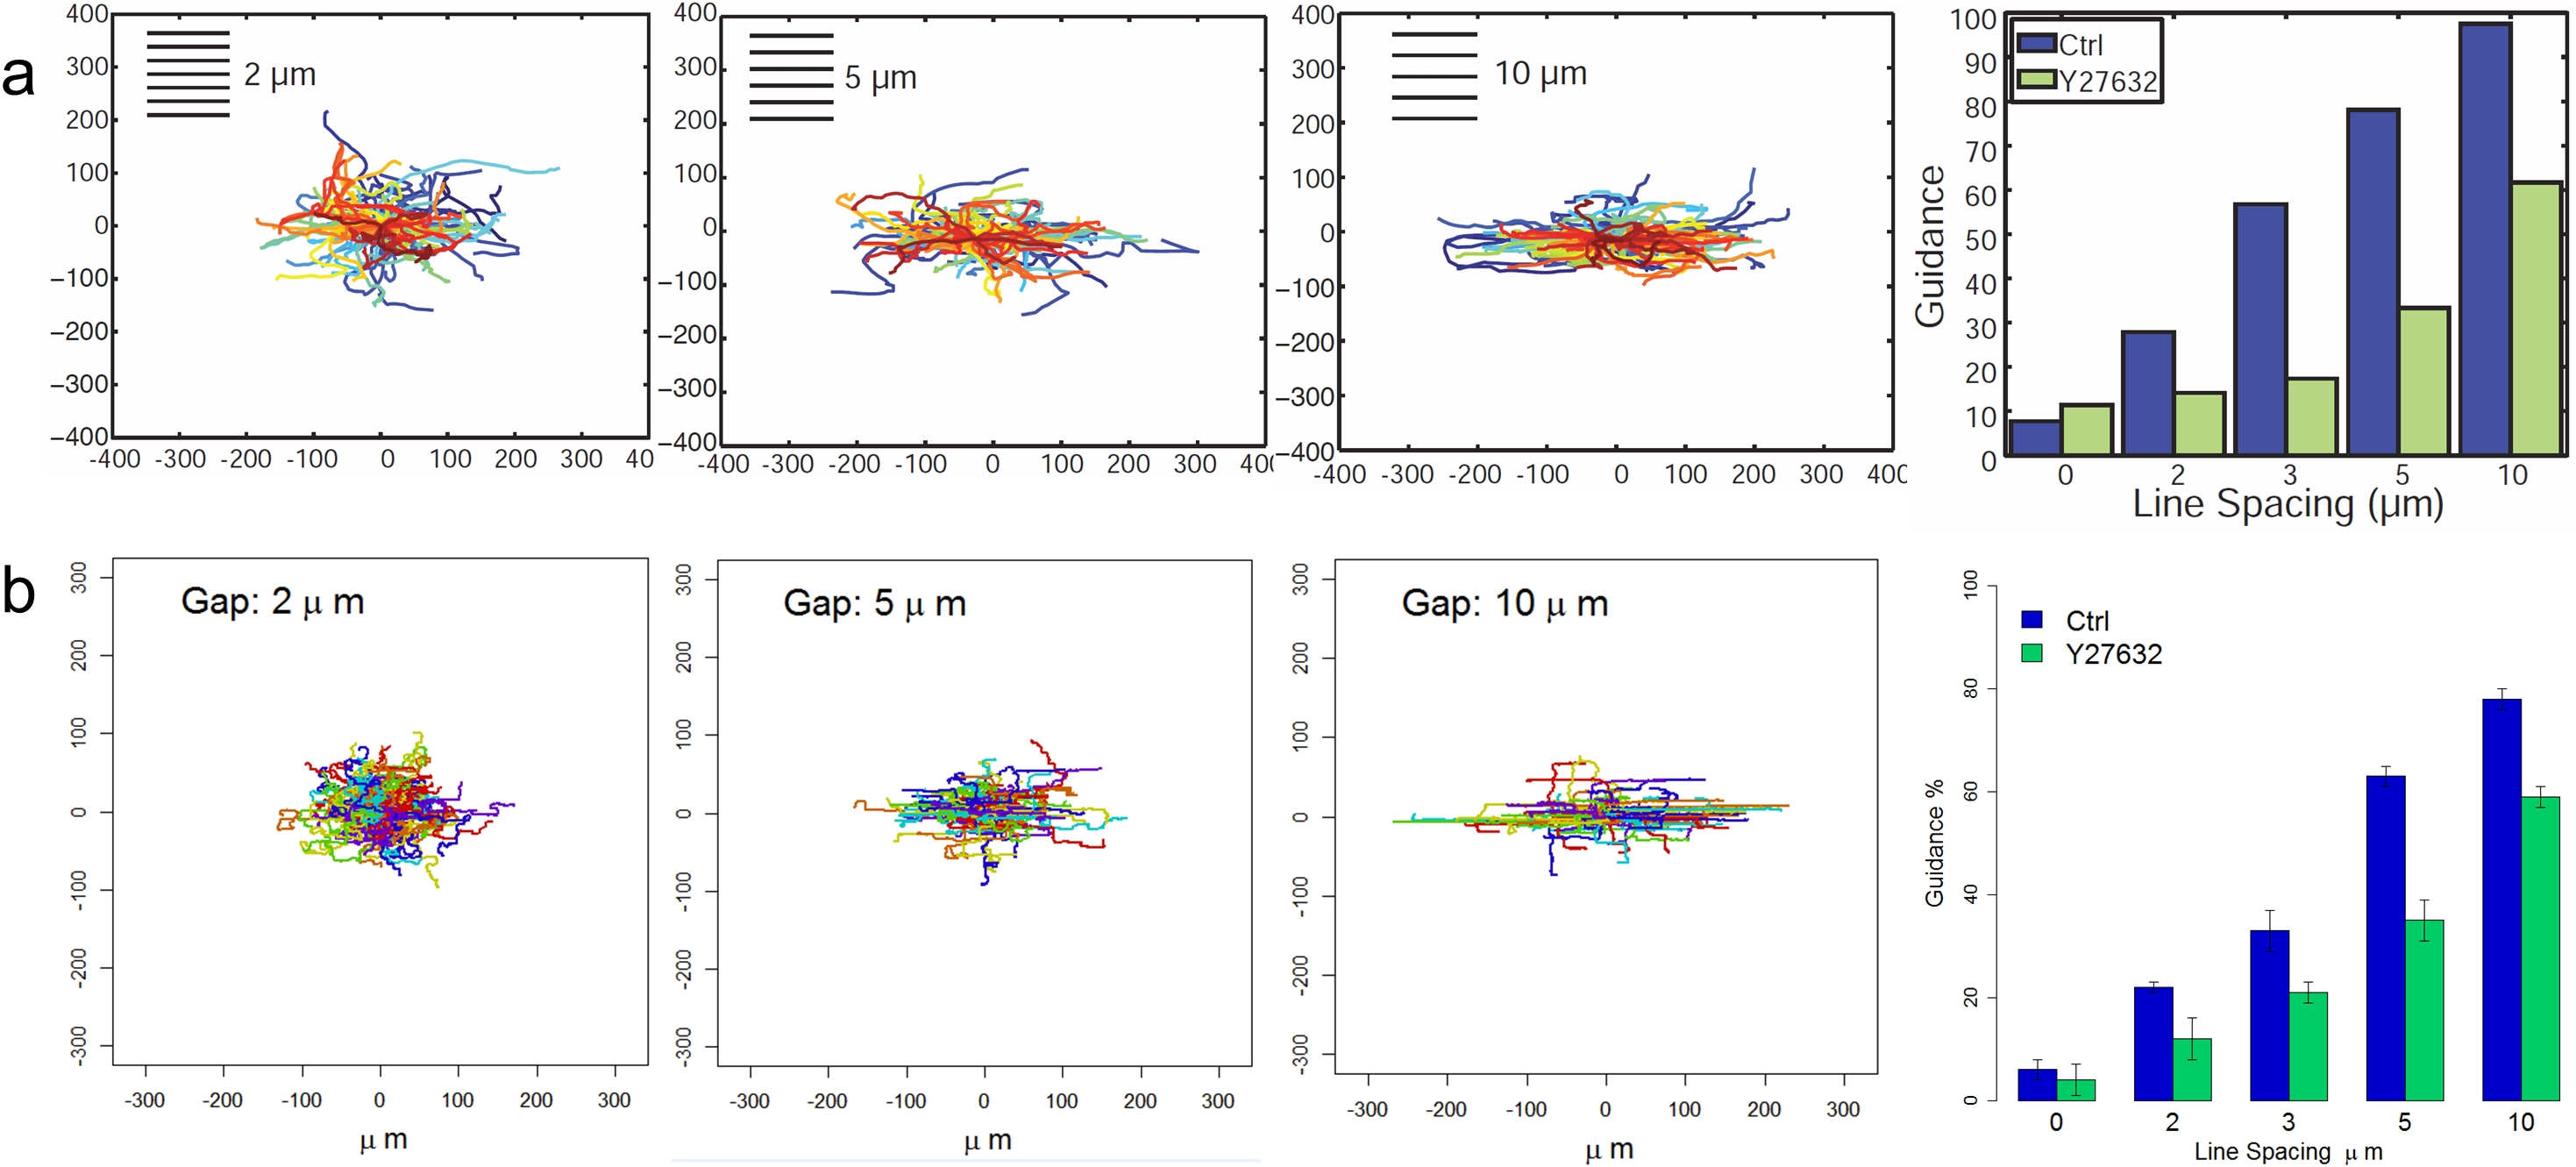
Cell orientation in response to ECM geometry under inhibition of Myosin II contractility. (a) The observed trajectory of cell migration path and corresponding guidance with treatment of Y27632. (b) The simulated trajectory of cell migration path and corresponding guidance with treatment of Y27632.